Triangle Pattern BreakdownWe can clearly see a triangle pattern break down, and also pharma sector is somehow a little bearish in my view. If market sentiment is negative, this can come further down.
Search in ideas for "triangle pattern"

CHOLAFIN - ASCENDING TRIANGLE PATTERNTriangle pattern is formed, it can break out if market sentiment is positive

Triangle pattern at the top of the channel - Will break !!Price forming triangle pattern at the top of the channel. If breaks down the triangle it should reach the channel bottom or Fibonacci 68.1% level. Wait for the break and enter the trade.

Triangle Pattern In KOTAKBANKThis is my first post, I am a noobie, with no experience.
DISCLAIMER: TRADING INVOLVES RISK, ALWAYS CONSULT A PROFESSIONAL FINANCIAL MANAGER BEFORE TAKING ANY DECISION. I SHALL NOT BE RESPONSIBLE FOR ANY MONETARY LOSS, NUCLEAR ATTACKS, YOUR BANKRUPTCY, OR YOUR WIFE BEATING SHIT OUT OF YOU.IF SOMETHING HAPPENS AND YOU POINT FINGER AT ME I WILL LAUGH AT YOU.
- If there is a breakout from triangle pattern, Short it.
- If there is a reversal, buy for swing trading.
- For long term investors, if there is a breakout 1135 is a good buy, you can accumulate a few.
NSE:KOTAKBANK

triangle pattern in wipro NSE:WIPRO wipro is forming triangle pattern with higher lows and getting resistance at same level , normally it should come down


Gold | Triangle pattern Triangle pattern observed in Gold. Pattern looks to be valid and the target comes at 1477.
1438 and 1382 are the trend defining levels and so conservatively, longs can be initiate beyond 1438.
(Disclaimer: Our charts and contents are just for the purpose of analysis, learning and general discussion. Do not consider these as trading tips or investment ideas. Trading in Stocks, Futures and Options carry risk and is not suitable for every investor. Hence it is important to do your own analysis before making any investment or trading decisions based on you personal circumstances and it is always better to take advice from professionals)

NIFTY | Triangle PatternTriangle pattern observed in Nifty. Look at Daily time frame and it's safer to wait for pattern confirmation in higher time frame. And keep in mind the round number 10700. So, trade according to your RR.

Triangle Pattern is forming in 5min ChartGold is consolidating within a triangle pattern, suggesting compression in price action. A downside break from this structure could trigger bearish continuation, especially if confirmed by strong volume and a close below key support levels

Triangle Pattern Strategy for Breakout within Range | Study OnlyThis chart showcases a symmetrical triangle pattern, where the price consolidates between two converging trendlines, indicating a period of market indecision. The formation of lower highs and higher lows suggests that the price is narrowing, setting up for a potential breakout.
Technically, the RSI is showing a bullish divergence as it rises from the oversold zone, while the MACD is crossing into positive territory, further supporting the possibility of an upward move. Volume indicators also highlight increasing interest, suggesting the potential for a breakout in the near term.
This is only view of my side by analysys of chart.
Note:
This analysis is purely for educational purposes and should not be considered as financial advice or a trading recommendation. Always conduct thorough research and consult a financial professional before making any trading decisions.
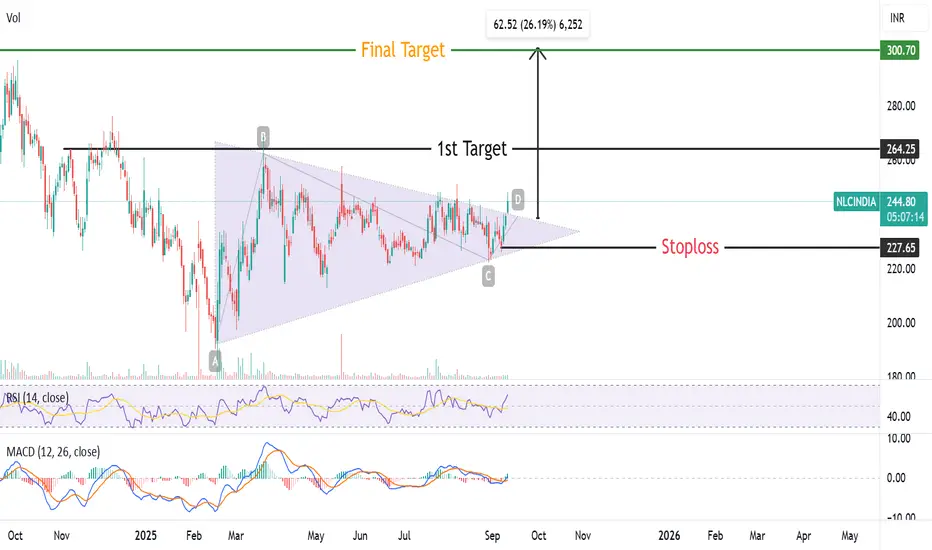
Triangle Pattern Breakout in NLC IndiaNLC INDIA given triangle pattern breakout on daily chart ..Stock is trading above. All important moving averages (20,50,100,200) .RSI & MACD also generated a buy signal ..Final Target will be arround 300rs with a stoploss of 227
Triangle pattern breakoutNice triangle pattern
Auto sector
Huge volume
PE is so good at this script
Consolidation

Triangle pattern This stock is Triangle pattern formation is created check volume and before invest.

Triangle patternPerfect triangle pattern high probability setup
Enter at the breakout candle with 2:1 resk to reward

triangle pattern breakout #CAMS #CAMS forming a symmetrical triangle pattern breakout. Watch the stock for next week

Triangle pattern breakout candidateThe stock is breaking out of a triangle pattern with strong volumes.
Can be added on the retest of zones. Kindly do your due diligence

Bajaj Finserv Triangle patternTriangle pattern with low volumes on weekly chart.
Keep a watch.
Breakout level 1740

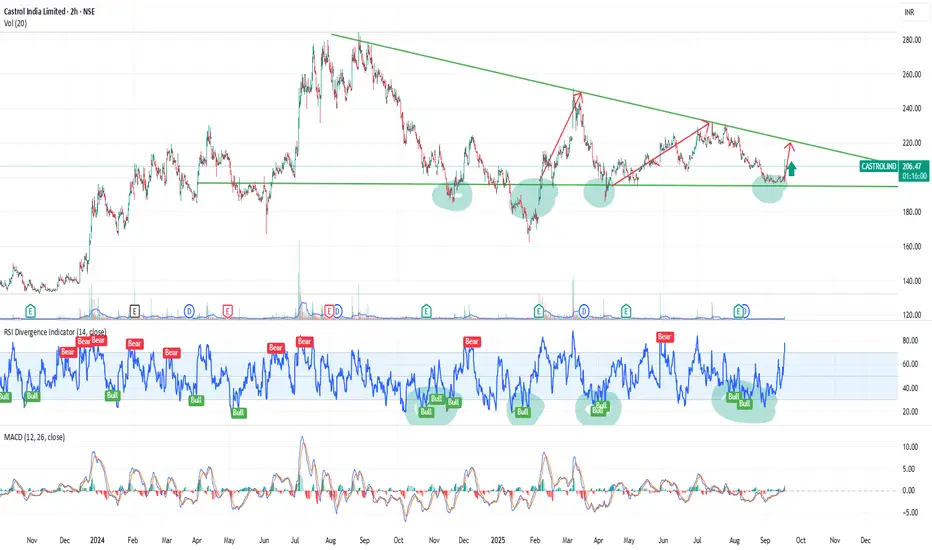
CASTROLIND TRIANGLE PATTERN BREAKOUTTriangle pattern break out and correction coming look for buy at previous resistance and if it breaks we can go for buy at trendline retest range.castrolind has potential of 40 to 50% returns.

Triangle pattern breakout Considering the promoters investment triangle pattern is expected to give break out.
Disclaimer: not an sebi registered, this is not a call just an analysis do your research before taking this trade.

Triangle Pattern Dear Traders,
This scrip is expected to give Breakout as it has formed a Triangle Pattern . So a traders Keep this scrip on your radar to catch the Momentum. Thanks to All.

Triangle Pattern in REC LTDI can see a triangle pattern in REC Ltd. Also drawn the levels if Breakout/ Breakdown happens.

Bhansali eng triangle pattern breakout 22 nov 23Triangle pattern breakout on bhansali eng on! 22 nov 23

Triangle pattern breakout in Havells HAVELLS
Key highlights: 💡⚡
✅On 1Day Time Frame Stock Showing Breakout of triangle Pattern .
✅Strong Bullish Candlestick Form on this timeframe.
✅It can give movement up to the Breakout target of 1435+.
✅Can Go short in this stock by placing a stop loss below 1295-.
